Energy Dashboards
Clear, role‑based views for cost, carbon and comfort—built for EMOS.
Track energy KPIs across every site, compare periods, and spot waste faster with AI‑assisted insights.
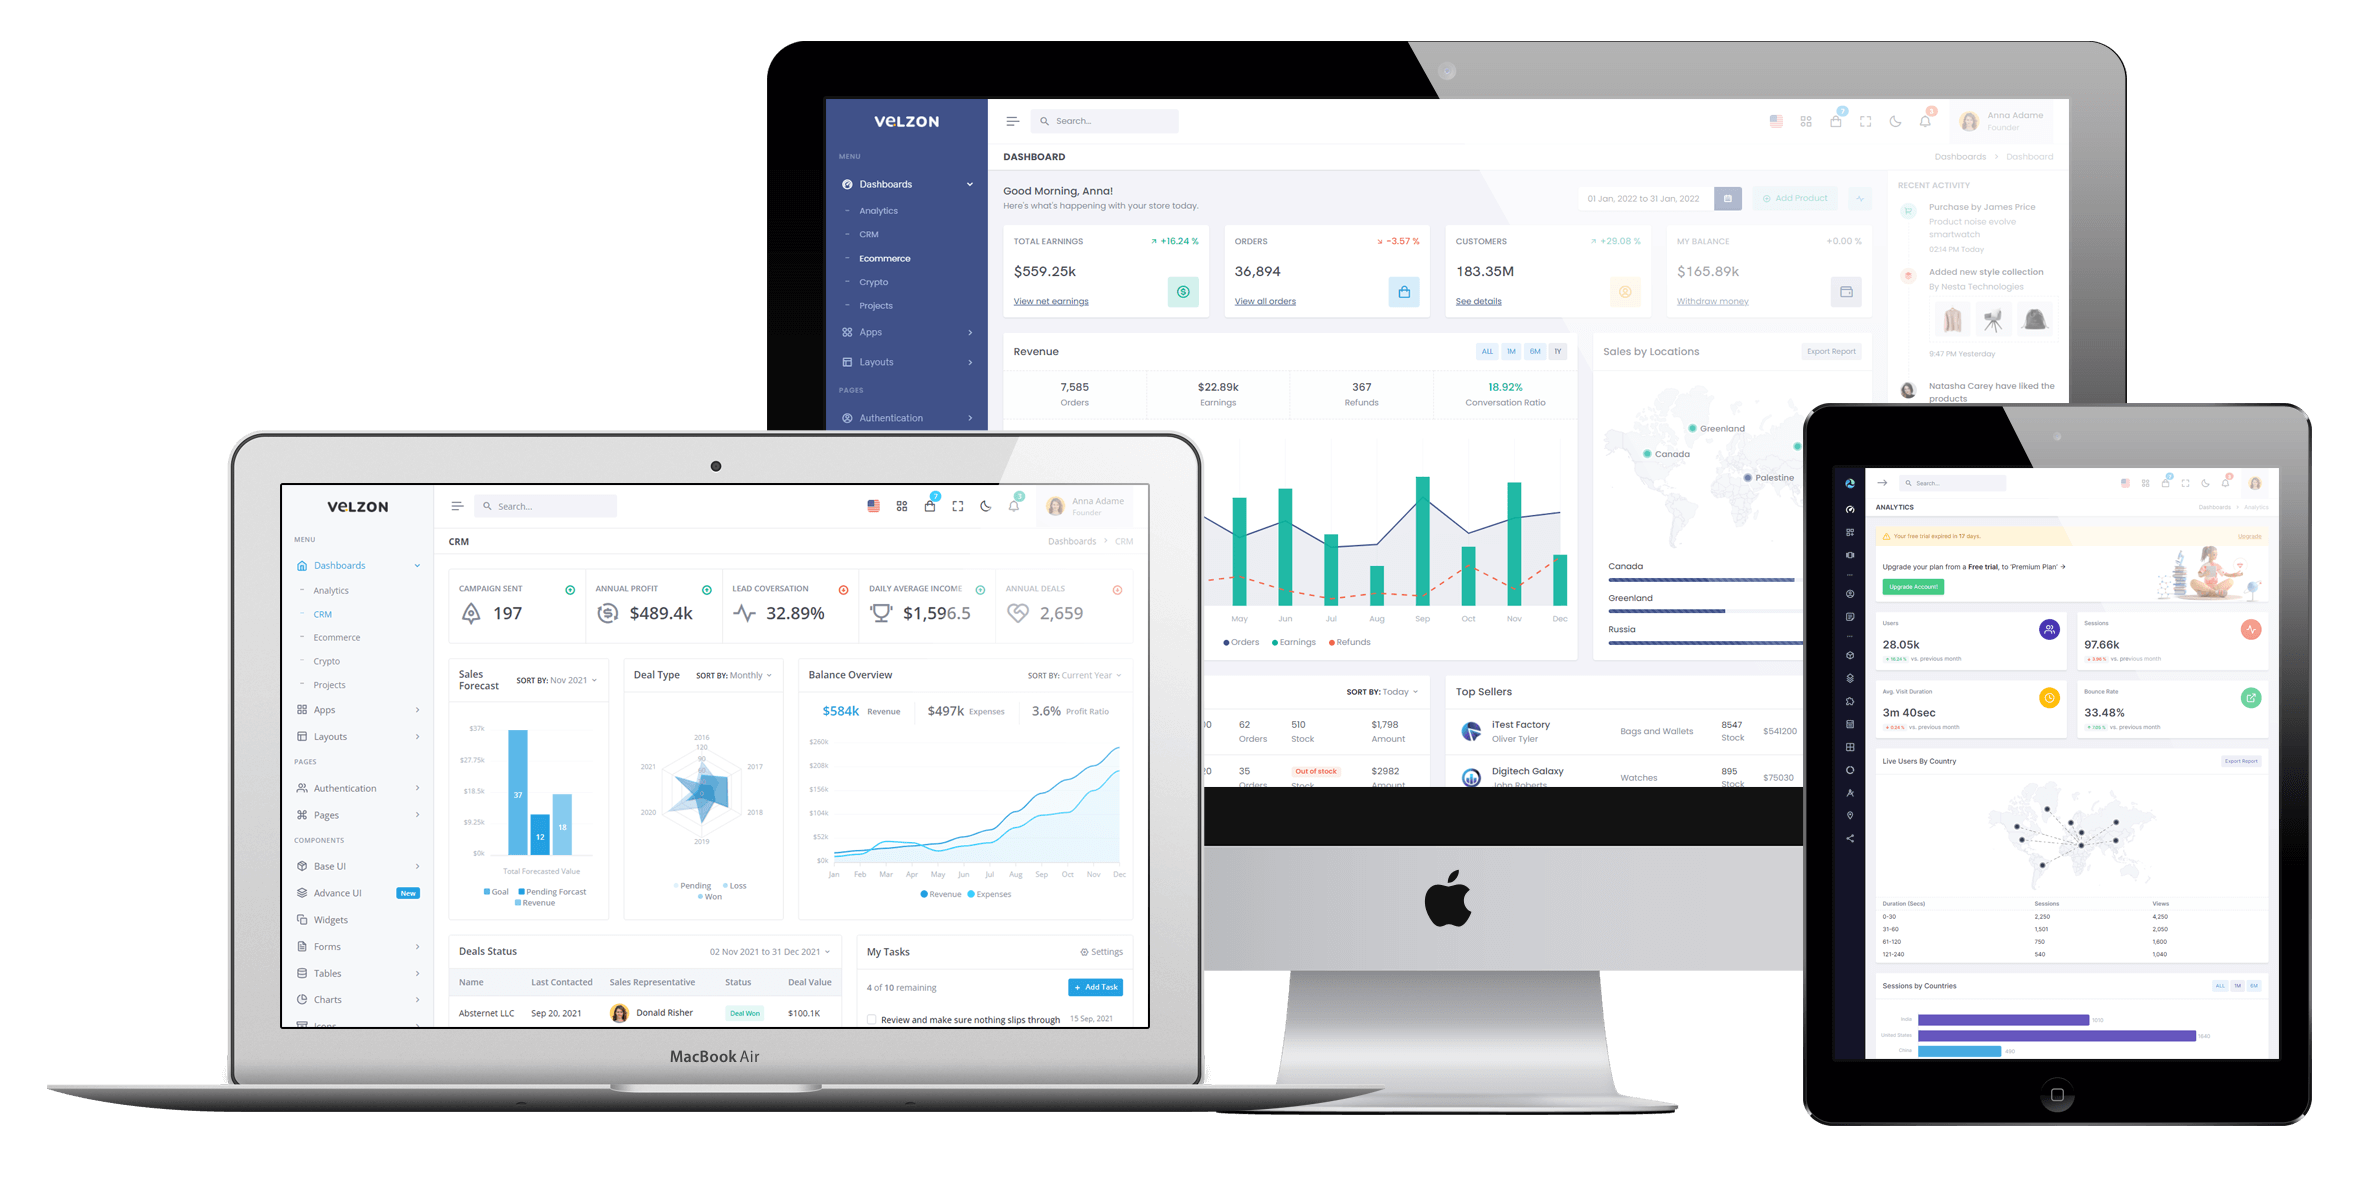
Live dashboard preview
Sample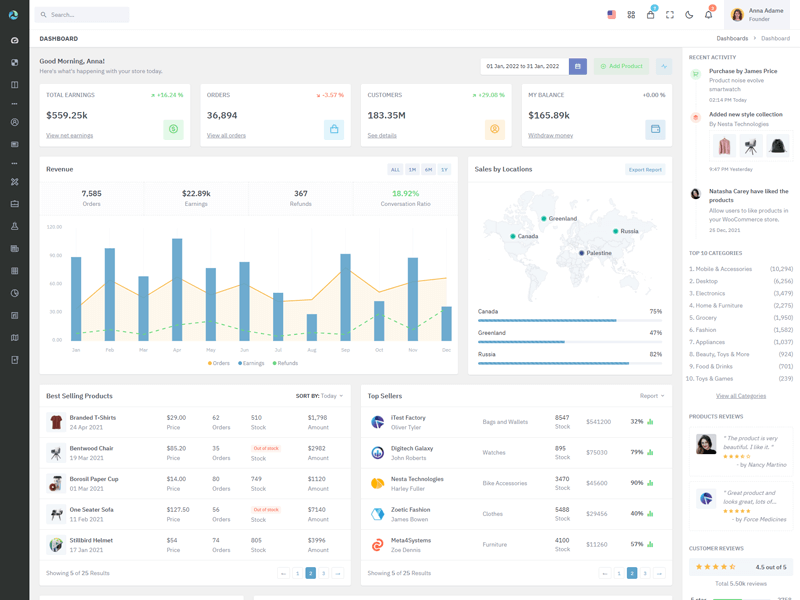
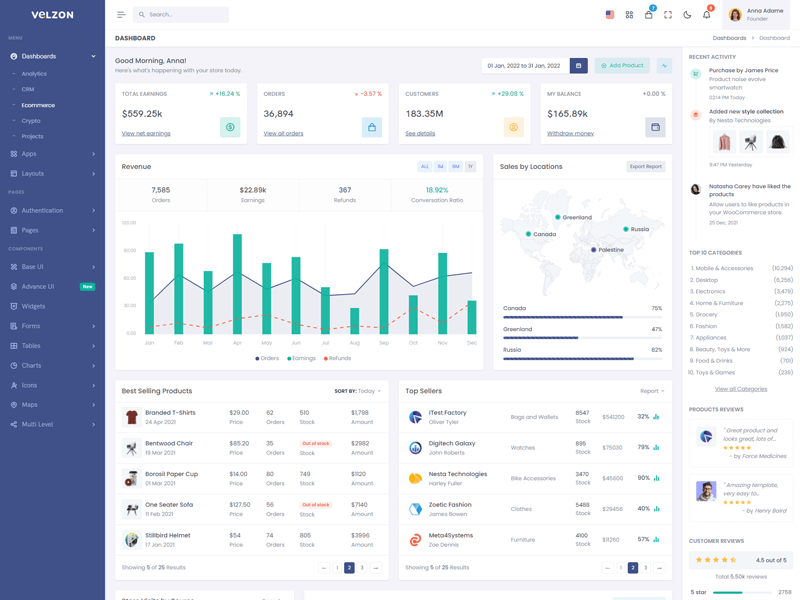
Executive snapshot with cost & usage trend and alert heatmap—what most teams use daily.
What you’ll see
- Energy cost, consumption and carbon KPIs
- Alert heatmap prioritised by £ impact
- Site benchmarking to find outliers fast
- Carbon intensity and SECR‑ready views
- Role‑based toggles for Facilities, Sustainability and Finance
Energy Cost
£128k
18% vs last year
Consumption
412 MWh
5% vs last year
Carbon
142 tCO₂e
11% vs last year
HVAC Runtime
−12%
YoY
Cost & Usage Trend
AI insights
Alerts Heatmap
Ranked by cost impact to focus your team on the biggest wins first.
Usage by Site
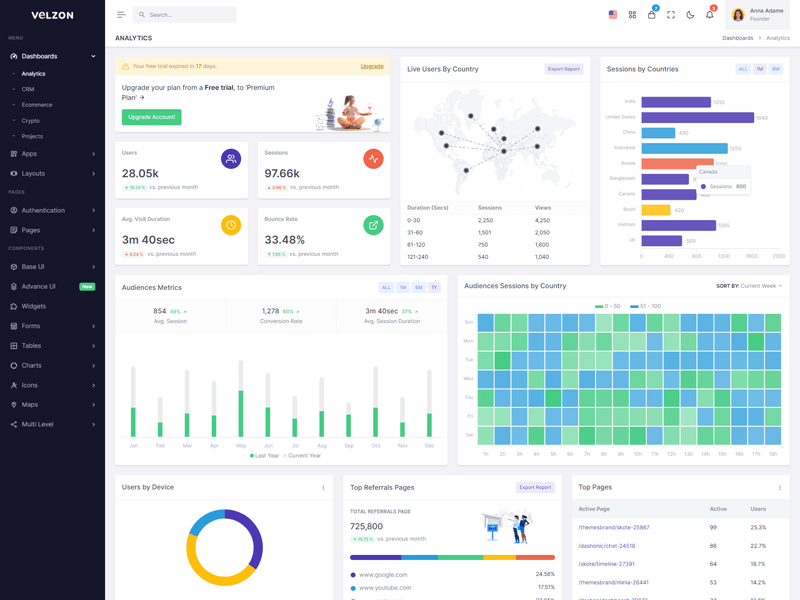
Carbon Intensity
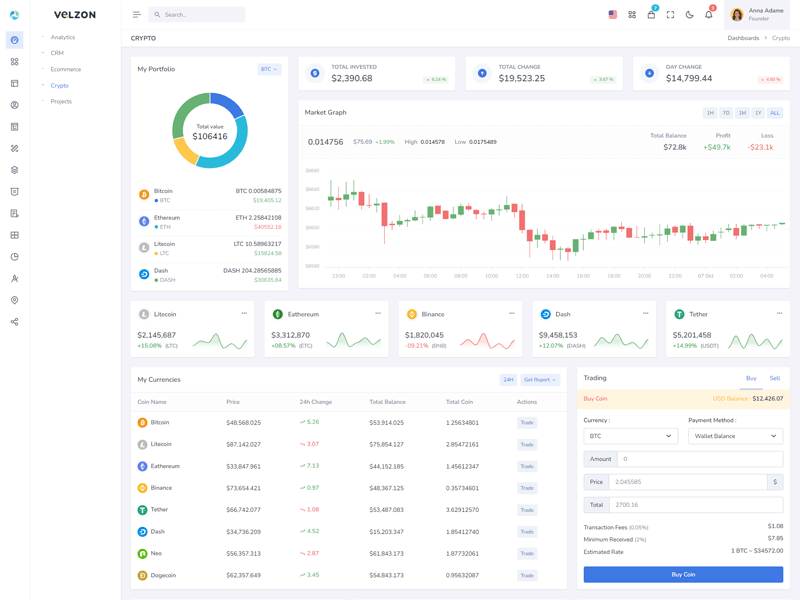
Facilities view
Shift schedules, runtime, and comfort exceptions in one place—prioritised by cost.
Overtime & out‑of‑hours detection
HVAC runtime & setpoint drift
Alert heatmap by cost impact

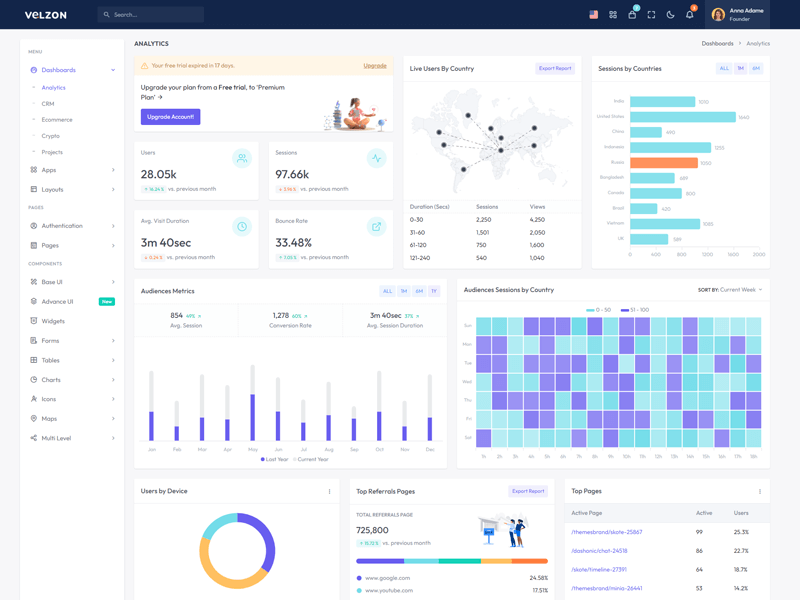
Sustainability view
Carbon, intensity factors, and SECR‑ready exports—done in clicks.
tCO₂e by site & scope
SECR evidence packs
Carbon intensity tracking
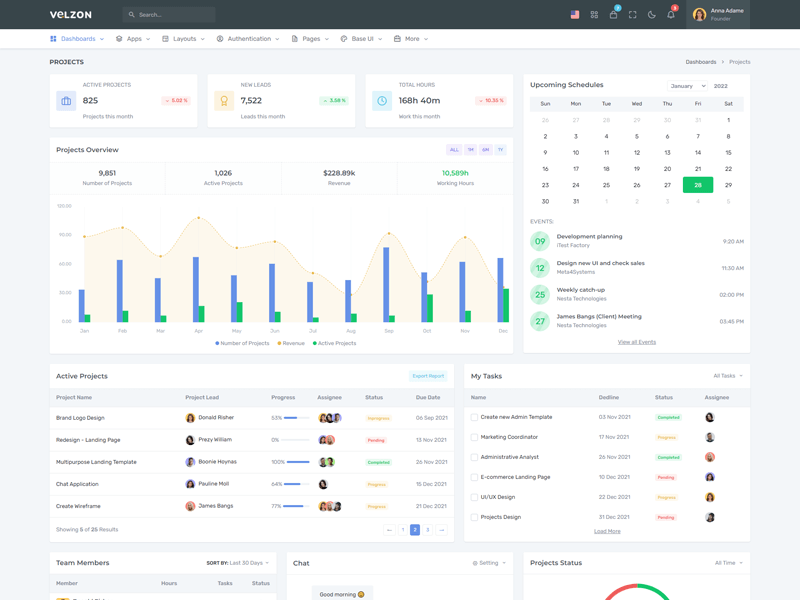
Finance view
Cost, variance and savings attribution for quick reporting.
Cost & usage variance
Budget vs actuals
Pilot ROI tracker